Connect Power BI to Azure Databricks
Project Overview
This guide walks you through connecting Microsoft Power BI to Azure Databricks SQL Warehouse, authenticating the connection, browsing Unity Catalog, selecting Gold Layer tables, and importing business-ready data for dashboard development.
By completing this guide, you will:
- Connect Power BI to Azure Databricks
- Configure Databricks Connection Settings
- Retrieve the Server Hostname and HTTP Path
- Authenticate using Azure Databricks
- Browse Unity Catalog
- Import Gold Layer Tables
- Prepare Data for Analytics
- Build Interactive Power BI Dashboards
Architecture
                Azure Data Lake Storage
                         │
                         ▼
                  Bronze Layer
                         │
                         ▼
                  Silver Layer
                         │
                         ▼
                   Gold Layer
                         │
                         ▼
               SQL Warehouse (Serverless)
                         │
                         ▼
                  Power BI Desktop
                         │
                         ▼
            Executive Business Dashboards
Prerequisites
Before connecting Power BI, ensure you have:
- Azure Subscription
- Azure Databricks Workspace
- Unity Catalog configured
- SQL Warehouse running
- Gold Layer tables created
- Power BI Desktop (Latest Version)
- Required permissions to access Unity Catalog
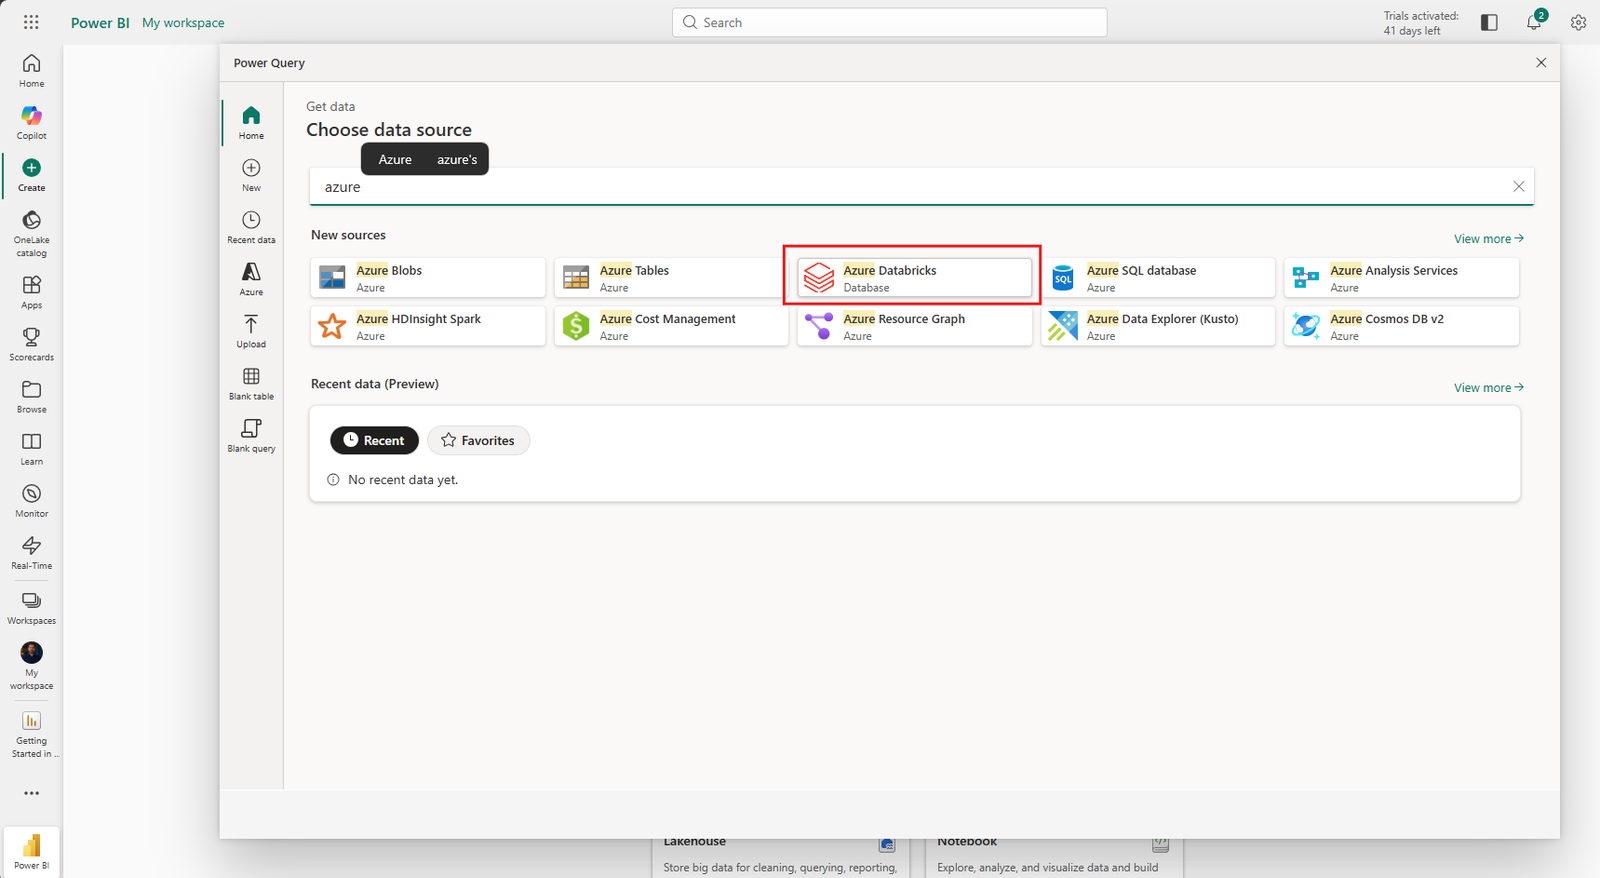
Step 1 — Open Power BI and Select Azure Databricks
Launch Power BI Desktop.
Navigate to:
Home
    └── Get Data
            └── Search "Azure Databricks"
Select
Azure Databricks
Click
Connect
Step 2 — Configure Connection Settings
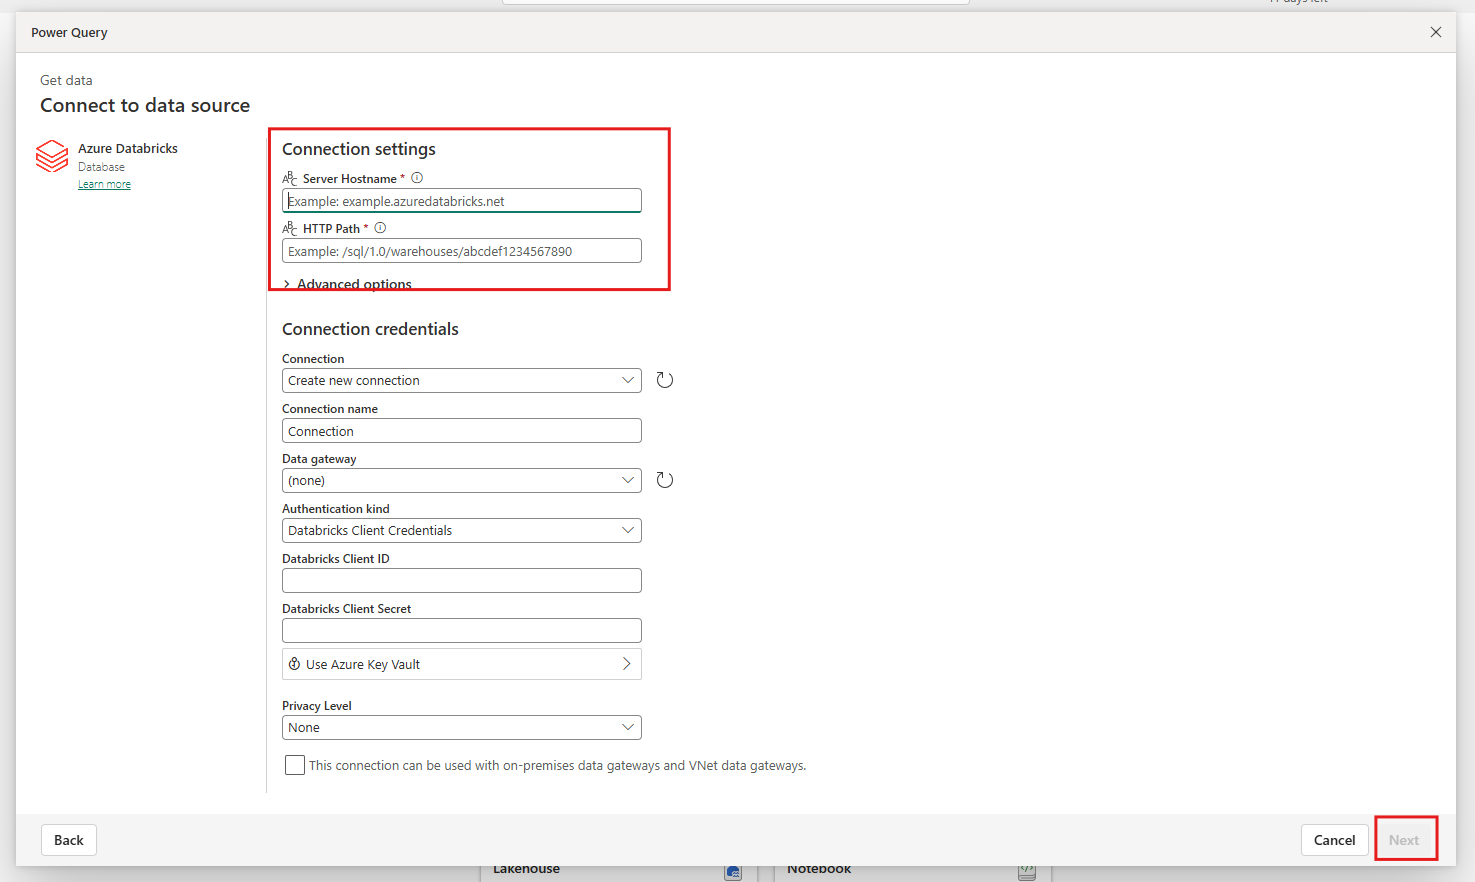
Power BI opens the Databricks connection window.
Provide the following information:
| Property | Value |
|---|---|
| Server Hostname | Azure Databricks Server Hostname |
| HTTP Path | SQL Warehouse HTTP Path |
Leave the remaining settings unchanged.
Click
Next
Step 3 — Retrieve Server Hostname and HTTP Path
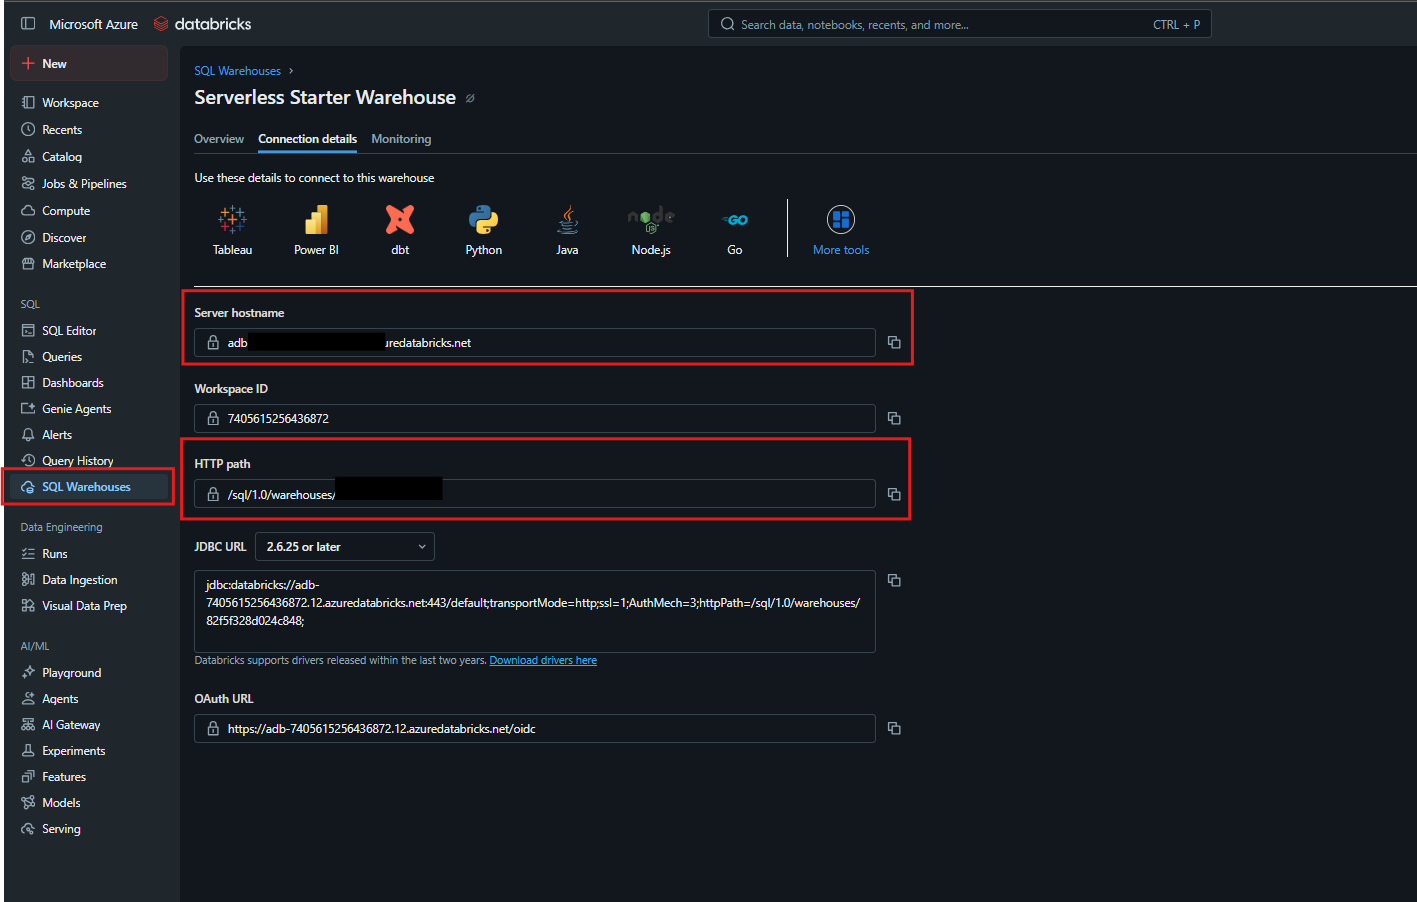
Open your Azure Databricks Workspace.
Navigate to:
SQL Warehouses
        └── Serverless Starter Warehouse
                └── Connection Details
Copy the following values:
Server Hostname
adb-xxxxxxxxxxxxxxxx.azuredatabricks.net
HTTP Path
/sql/1.0/warehouses/xxxxxxxxxxxxxxxx
Return to Power BI.
Paste both values into their respective fields.
Click
Next
Step 4 — Authenticate with Azure Databricks
Power BI prompts for authentication.
Choose one of the supported authentication methods.
Recommended:
Microsoft Entra ID (Azure Active Directory)
Alternatively, use:
- Personal Access Token (PAT)
Complete the authentication process.
Step 5 — Browse Unity Catalog
After successful authentication, Power BI displays the Databricks catalog hierarchy.
Expand:
Azure Databricks
        └── Catalog
                └── Schema
                        └── Tables
Locate your project catalog.
Example:
ecommerce
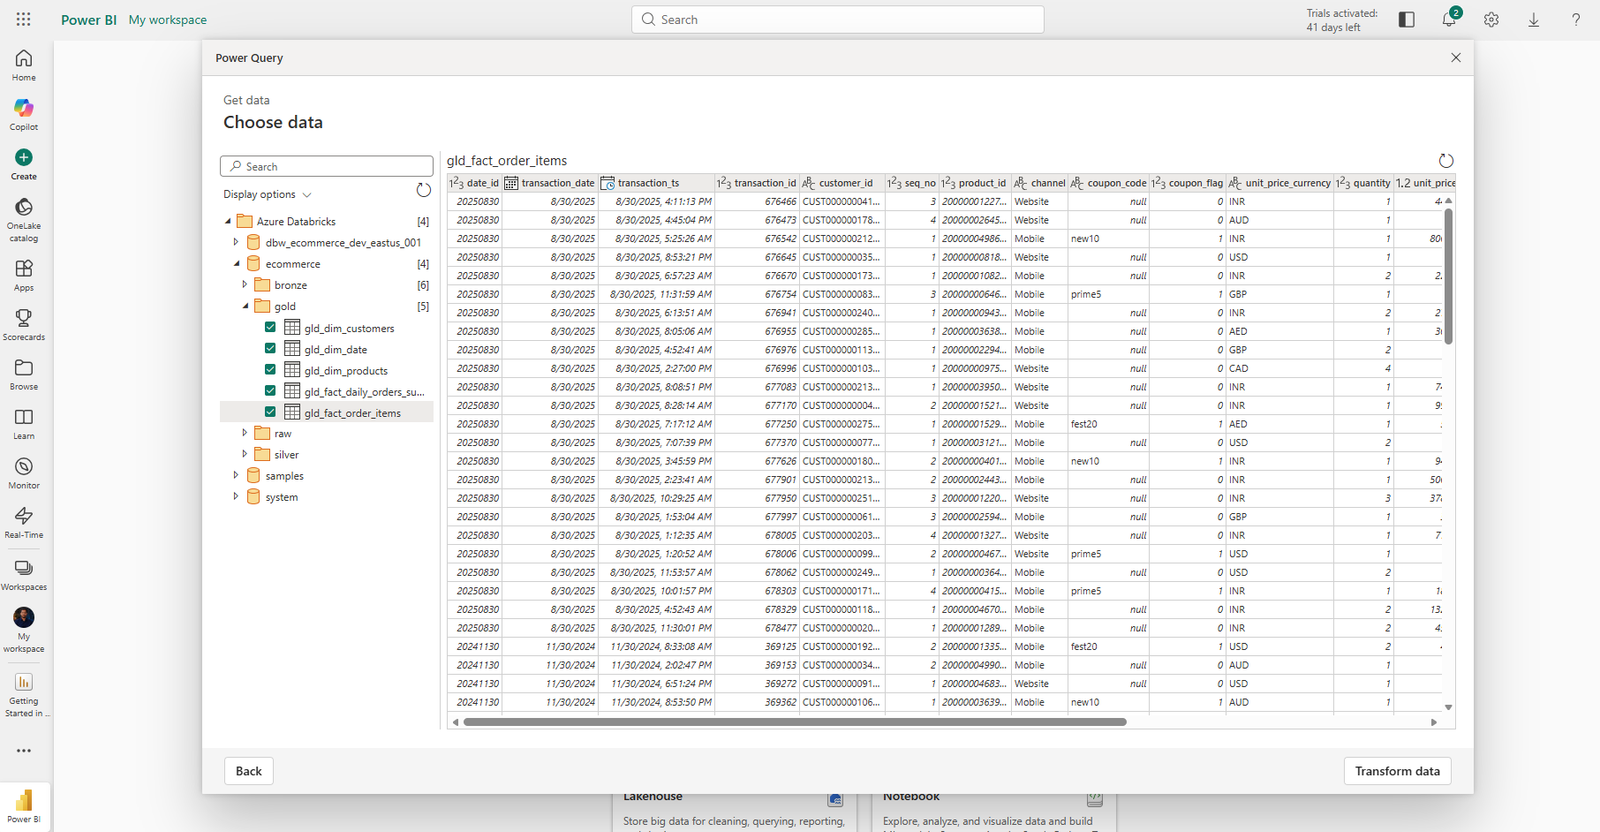
Step 6 — Select Gold Layer Tables
Expand the Gold schema.
Example:
ecommerce
        └── gold
Select the required business tables.
Recommended tables:
- gld_dim_products
- gld_dim_customers
- gld_dim_date
- gld_fact_order_items
- gld_fact_daily_orders_summary
Click
Transform Data
or
Load
Step 7 — Verify Imported Tables
After loading completes, verify that:
- Tables appear in the Fields pane.
- Data preview loads successfully.
- No authentication errors occur.
- Relationships can be created.
Example imported tables:
Gold
├── gld_dim_products
├── gld_dim_customers
├── gld_dim_date
├── gld_fact_order_items
└── gld_fact_daily_orders_summary
Step 8 — Build the Data Model
Create relationships between the imported tables.
Example Star Schema:
                gld_dim_products
                        │
                        │
                        ▼
gld_dim_customers ─── gld_fact_order_items ─── gld_dim_date
                        │
                        ▼
        gld_fact_daily_orders_summary
Step 9 — Create Visualizations
Build interactive dashboards using imported data.
Recommended visualizations:
- Revenue Trend
- Daily Sales
- Customer Analysis
- Product Performance
- Country-wise Sales
- Top Products
- Top Customers
- Order Summary
Step 10 — Publish to Power BI Service
Once the report is complete:
Navigate to
Home
        └── Publish
Publish the report to:
My Workspace
or
Production Workspace
Configure scheduled refresh if required.
Connection Workflow
Power BI Desktop
        │
        ▼
Azure Databricks Connector
        │
        ▼
SQL Warehouse
        │
        ▼
Unity Catalog
        │
        ▼
Gold Schema
        │
        ▼
Business Tables
        │
        ▼
Power Query
        │
        ▼
Power BI Data Model
        │
        ▼
Interactive Dashboards
Recommended Gold Tables
| Table | Purpose |
|---|---|
| gld_dim_products | Product Dimension |
| gld_dim_customers | Customer Dimension |
| gld_dim_date | Calendar Dimension |
| gld_fact_order_items | Sales Fact |
| gld_fact_daily_orders_summary | Daily Sales Summary |
Dashboard Recommendations
| Dashboard | Description |
|---|---|
| Executive Dashboard | Business KPIs |
| Sales Dashboard | Sales Analysis |
| Customer Dashboard | Customer Insights |
| Product Dashboard | Product Performance |
| Country Dashboard | Regional Sales |
| Revenue Dashboard | Revenue Trends |
| Orders Dashboard | Order Analysis |
Troubleshooting
Authentication Failed
Verify:
- SQL Warehouse is running.
- Microsoft Entra ID permissions.
- Personal Access Token validity.
- Workspace access.
Unable to Connect
Verify:
- Server Hostname is correct.
- HTTP Path is correct.
- SQL Warehouse is active.
No Tables Visible
Verify:
- Unity Catalog permissions.
- Gold schema exists.
- User has SELECT permission.
Slow Performance
Possible reasons:
- Large datasets
- SQL Warehouse is stopped
- Network latency
- Importing unnecessary tables
Best Practices
- Connect only to the Gold Layer.
- Keep SQL Warehouse running during refresh.
- Use descriptive table names.
- Create a Star Schema in Power BI.
- Hide unnecessary columns.
- Configure scheduled refresh in Power BI Service.
- Secure data using Unity Catalog permissions.